
Web design by AMC SYSTEMS 2024



Karlan Monolog PC software suite
These are screen grabs showing some of the features available within our Karlan Monolog software suite. From live data graphs through to historic data tables, we are sure you will find this software invaluable. With it’s Internet data facility, you can also send your live data to a web site of your choice. Gather daily, monthly and annual tide and weather statistics, view, print, add and save comments, overlay any weather data parameter on top of tide, swell and prediction data. Far too many features to describe here so if you require any more information, please contact us
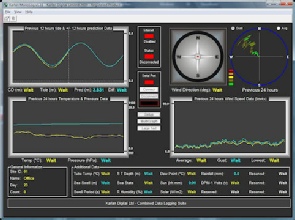
Monolog main screen showing live data in both graph and text formats
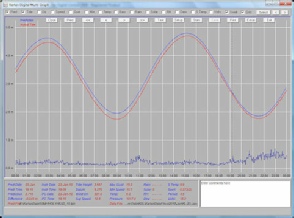
Multigraph main screen showing tide, prediction and swell data
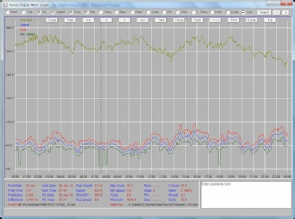
Multigraph main screen showing wind data
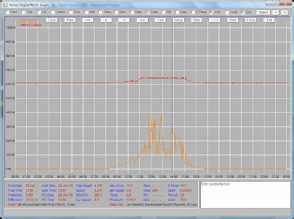
Multigraph main screen showing solar data
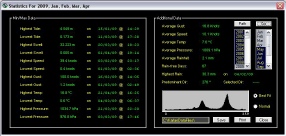
Multigraph stats screen showing statistical data
Text data screen showing all environmental data in an easy-to-read format